A Photograhpic Record of Leaf Freezing Events in the Field
Produced Atomatically With Inexpensive Cameras and a Datalogger
L.S. Baker and C.D. Upper, Plant Pathology, and ARS, USDA, University of
Wisconsin - Madison.
Two Minolta Disk-7 cameras were positioned 40 cm.
above a row of shap beans, aimed downwards with the same group of leaves
in view of both cameras.
A 0.076 mm. thermocouple (ie. electronic leaf temperature sensor) was attached
to the underside of a leaflet at the top of the camopy and in view of both
cameras.
-
Air temperature, dew-point depression and leaf wetness were measured just
above the canopy near this leaf.
-
These sensors were monitored by a Campbell
21X data logger which also controlled the camera shutters.
-
The data logger was programmed to monitor these sensors each half hour
and to begin a sequence of pictures when either the leaf or the air temperature
fell below 0 C.
-
Both cameras took the first picture at the same time. Thereafter one camera
took a picture every 15 minutes and the other every half hour.
-
As long as the temperature of either the air or the leaflet remained below
0 C, temperatures were recorded every 10 seconds.
The first killing frost of the
1987 growing season, in southern Wisconsin, occurred during the night of
October 2nd. The afternoon was cold, cloudy, and dry with strong to very
strong winds. The skies cleared just after dark, and the winds decreased
throughout the night.
At 2100 ( 9:00 PM) the leaf temperature
went below zero degrees Celsius (32 F.) and the photographic sequence was
automatically initiated.
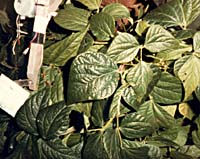
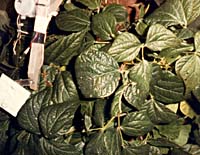
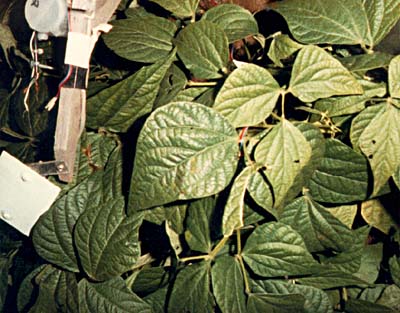
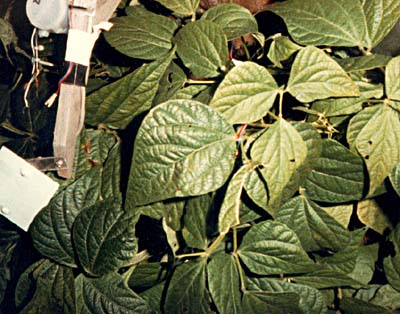
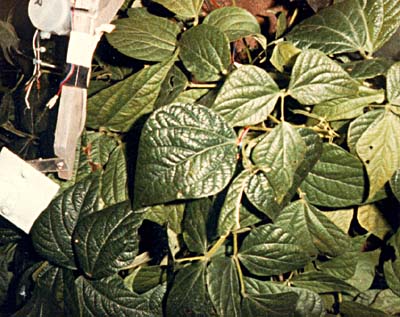
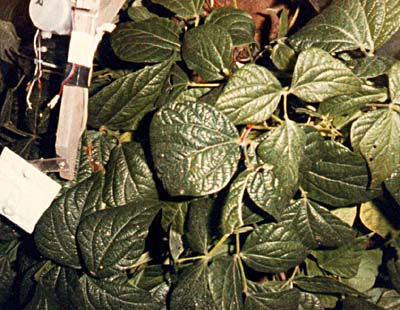
The pictures below represent the
period between 2200 and 0130. Within this period all the leaves in view
froze. The progression of leaf freezing can be seen as a darkening of the
leaf tissue. Can you
tell, from the pictures, when the freezing event occured?
(Click on any picture to enlarge
frame)
 2200
2200 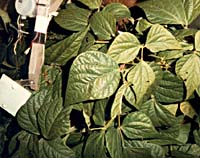 2230
2230
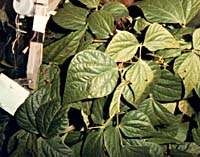 2300
2300 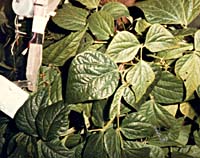 2330
2330
 2400
2400 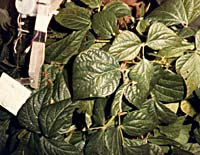 0030
0030
 0100
0100 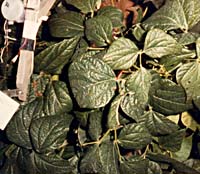 0130
0130
 2200
2200 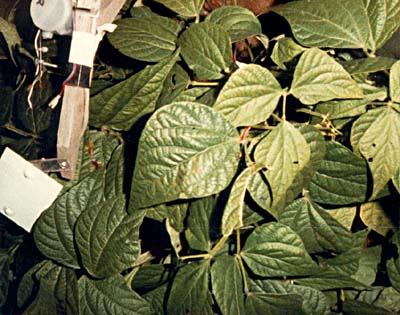 2230
2230
 2300
2300 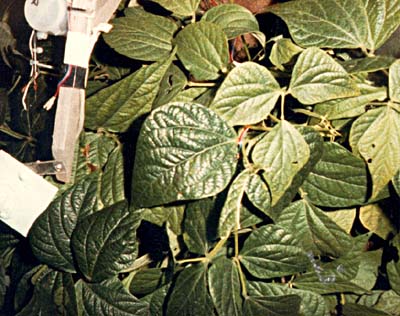 2330
2330
 2400
2400 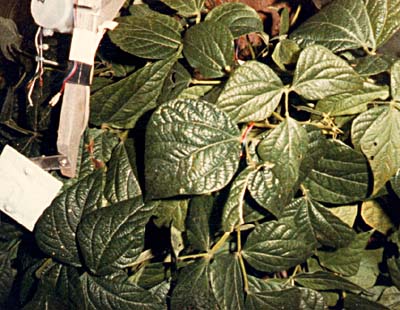 0030
0030
 0100
0100 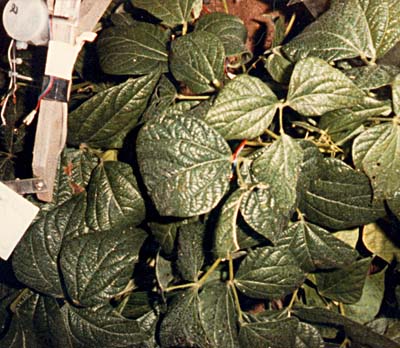 0130
0130